Prevalence and Characteristics of Women with Persistent LBP Postpartum
Authors Info & Affiliations
Abstract
Background:
Persistent low back pain (LBP) postpartum is a known phenomenon; however, the prevalence and characteristics thereof were unknown in South Africa.
Objectives:
This study determined the point prevalence and characteristics of women with persistent LBP postpartum.
Methods:
A cross-sectional quantitative design was used. Women over 18 years who gave birth more than six weeks prior to the study were included. Data were collected for both groups through physical measurements and questionnaires. Descriptive, correlational, and non-parametric statistical analysis was conducted.
Results:
50 women participated in the study, and 22 (44%) presented with persistent LBP postpartum. The group with LBP experienced a higher level of disability (54.5% - moderate disability and 4.5% - severe disability) compared to the pain-free group. Postnatal depression was indicated in 40.9% of the LBP group and was statistically significantly and moderately positively associated with the presence of LBP (p=0.000; r=0.53). Regarding activity and participation levels, 59.1% of females with LBP postpartum had a moderate risk for chronicity, and 13.6% had a high risk. The LBP pain group differed significantly in terms of participation in physical activity (p=0.000) compared to the pain-free group.
Conclusion:
The results indicated a high point prevalence of LBP six or more weeks postpartum (44%). On impairment level, disability and postnatal depression experienced by women with LBP postpartum differed from the pain-free group. Participants who were pain-free were much more physically active than participants with LBP. The results from the study implied low levels of physical activity in the presence of LBP.
1. INTRODUCTION
Musculoskeletal pain, specifically low back pain (LBP), is one of the most common conditions treated by physiotherapists worldwide [1]. Physiotherapists are not only responsible for treating LBP but also for the prevention of symptoms, where possible [2]. However, prevention is not possible when the factors contributing to the experience of LBP are not known. Pregnant women often experience LBP, which not only has a negative psychological impact but also causes limitations in the performance of activities of daily living [3]. Most of the pregnant population who is affected by LBP usually experience resolution of symptoms six weeks postpartum [3]. There is, however, conflicting evidence regarding the resolution of LBP postpartum, and it has been reported that the prevalence of persistent LBP after pregnancy varies from 5-50% [4-6]. In South Africa, no published records could be found to indicate the prevalence of persistent LBP postpartum.
Several risk factors have been associated with persistent LBP postpartum, i.e., increased body mass index (BMI), depression, and heavy workloads [5]. Additionally, the age at which the woman gave birth could also be a contributing factor to persistent LBP [7]. It was found that women who gave birth to at least two children before the age of 20 were more likely to experience persistent LBP [7]. The physical factors contributing to the experience of persistent LBP after pregnancy have not been extensively researched. Some studies indicate that diastasis abdominous recti (a tear in the abdominal muscles) contribute to the experience of LBP during and after pregnancy, but there was no evidence that this contributes to persistent LBP [8, 9].
Persistent LBP does not only cause discomfort but can lead to disability, decreased health-related quality of life, decreased activity levels and kinesiophobia [10]. Women with persistent LBP have reported a decreased ability to perform their occupations, participate in hobbies and social events and complete tasks in and around their houses [11]. In South Africa, the prevalence of persistent LBP postpartum and the characteristics thereof are not known, although it is frequently seen in clinical practice. This study, therefore, aimed to determine the point prevalence and characteristics of persistent LBP postpartum.
2. MATERIALS AND METHODS
2.1. Study Design and Setting
The study was conducted among postpartum patients who presented to an outpatient department (OPD) at a tertiary hospital in Gauteng, South Africa. A descriptive, cross-sectional, non-experimental study design was implemented.
2.2. Study Population and Sampling
All women who gave birth more than six (6) weeks prior to the study were targeted for inclusion. The following eligibility criteria were used:
Inclusion criteria: All females who had given birth 6 weeks prior to the onset of the study, who were between the ages of 18 and 45 years old, and who provided voluntary informed consent.
Exclusion criteria: All females who had known orthopaedic pathology (such as osteoarthritis; osteoporosis; etc.); cancer affecting the structures of the low back or pelvis; or who had experienced trauma or surgery to the lower back or pelvis in a 6-month period prior to the onset of the study.
2.3. Research Procedure
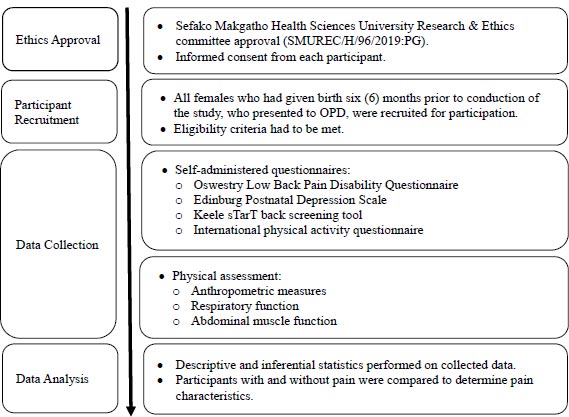
Screening of eligible participants took place daily for a 6-month period at the OPD of a tertiary hospital. Participants who met the inclusion criteria were informed of the aims of the study and had to sign a voluntary informed consent prior to inclusion. Participants were then asked to complete self-administered questionnaires, and the researcher conducted an anthropometric-, respiratory-, and abdominal muscle function assessment on each participant. Once data was obtained, the participants were divided into two groups: group 1 consisted of females who experienced persistent LBP postpartum, and group 2 consisted of females who did not experience LBP. The results obtained were analysed separately and comparatively for the two groups. All participants who experienced LBP were referred to a qualified physiotherapist for management and further follow-up. Referrals to other specialists (i.e., orthopaedic surgeons, neurologists, psychologists, etc.) were made as appropriate for each participant. The research procedure is illustrated in Fig. (1).
2.4. Instruments and Tools
To get a comprehensive clinical picture of the characteristics of persistent LBP postpartum, a combination of questionnaires and physical tests were used. The instruments and tools were selected according to their classification on the International Classification of Health, Disability and Function (ICF). A pilot study was conducted to ensure the applicability and feasibility of the execution of the tests in the South African context. The instruments and tools that were used were:
Stadiometer: The portable stadiometer has been used in a variety of settings to measure the height of patients and participants in research projects [12]. The reliability and validity of stadiometers were tested on a population of adults, ranging from 22 to 57 years old. The inter- and intra-examiner reliability was found to be very high (ICC = 0.999). The technical error measurements were also excellent (R=99.92%).
Electronic Bathroom Scale: The validity and reliability of electronic bathroom scales to measure weight has been debated in the literature. It was found that electronic (digital) bathroom scales were significantly more reliable than manual (dial) bathroom scales (p<0.05) [13]. Electronic (digital) bathroom scales were found to be consistent with measuring weight and can be used in public health research [13].
Body Mass Index (BMI): Although no evidence exists that BMI is valid and reliable, it has been used in published literature to measure pregnant women [14]. It was found that if the data was captured in a standard format (in the South African context, using the metric system), the BMI calculations had excellent face validity [14]. The formula that was used for calculating BMI was: BMI = mass / height2.
Oswestry LBP Disability Questionnaire (OSWS): The OSWS has been used extensively in published research. The tool has good construct validity; acceptable internal consistency (Cronbach α = .71-.87); and the test-retest reliability and responsiveness are high (ICC=0.84-0.94) [15].
Peak Flow Meter: The peak flow meter was selected to measure the respiratory function of participants. Portable peak flow meters have not been extensively tested for validity and reliability, but they have been tested for accuracy. Authors suggest that if the same make and model peak flow is used, the results are accurate in a population [16, 17]. For the current study, the same make and model peak flow meter was used to ensure accuracy.
Trunk Stability Test: The trunk stability test is a widely used clinical tool, but it has not been extensively studied for reliability and validity. In the neurologically impaired population, the tool has been found valid (r=0.62) and reliable (ICC: 0.979) [18].
Edinburgh Postnatal Depression Scale (EPDS): The EPDS is the most frequently used instrument to determine postpartum depression. The tool has been found valid (ICC=0.85) and reliable (r=0.66) for use in clinical research [19].
Keele sTarT Back Screening Tool: The Keele sTarT Back Screening Tool (SBT) has been tested for validity and reliability in a large number of populations. The tool has excellent validity (ICC=0.89), and the test-retest-reliability was found to be sufficient [20].
International Physical Activity Questionnaire (iPAQ): The iPAQ is the tool that was selected to assess the participation of the participants in the study. The iPAQ has sufficient criterion validity and good reliability (ICC=0.65 for females) [21].
2.5. Data Analysis
The Cronbach’s Alpha coefficient was used to test for internal consistency and reliability of the data gathered. The test can be applied to variables that form a known scale together. In the current study, the OSWS and SBT scales could be tested. The results indicate that the OSWS scale provided a Cronbach’s Alpha value of 0.858, and the SBT scale provided a Cronbach’s Alpha value of 0.832. This suggests that the items have relatively high internal consistency. Note that a reliability coefficient of 0.70 or higher is considered “acceptable” in most social science research situations.
2.6. Ethical Considerations
Prior to the conduction of the study, the proposal was approved by the Sefako Makgatho Health Sciences University Research and Ethics Committee (SMUREC/H/96/2019:PG). Permission to conduct the study was obtained from the Chief Executive Officer of the tertiary hospital in Gauteng, South Africa. Participants were required to provide informed, voluntary consent prior to participation in the study. The principles set out by the Declaration of Helsinki were used throughout the conduction of the study.
| Aspects Tested | N | Min | Max | Mean | Std. Deviation | |
| Demographics | Age in years | 50 | 19 | 46 | 30.56 | 5.84 |
| Nr of children given birth to | 50 | 1 | 4 | 2.08 | 0.88 | |
| Anthropometric data | Height in centimetres | 50 | 150 | 174 | 164.00 | 4.90 |
| Weight during pregnancy (or directly after giving birth) | 50 | 45 | 125 | 82.73 | 18.89 | |
| Weight at the time of the study | 50 | 52 | 120 | 79.87 | 17.46 | |
| BMI | 50 | 19.8 | 44.6 | 29.64 | 6.20 | |
| Respiratory function | Actual Peak Flow | 50 | 131.3 | 396.7 | 259.23 | 61.73 |
| Ideal Peak Flow | 50 | 406.6 | 476.0 | 445.44 | 13.13 | |
| Difference between ideal and actual peak flow | 50 | 59.8 | 317.8 | 186.21 | 61.76 | |
| Abdominal muscle function | Trunk Stability Test: Abdominal muscle functioning on the left | 50 | 0.0 | 0.4 | 0.15 | 0.10 |
| Trunk Stability Test: Abdominal muscle functioning on the right | 50 | 0.0 | 0.6 | 0.17 | 0.14 | |
| Trunk Stability Test: Average | 50 | 0.0 | 0.5 | 0.16 | 0.09 | |
| Pain | OSWS: pain intensity | 50 | 0 | 3 | 0.58 | 0.86 |
| OSWS: personal care | 50 | 0 | 3 | 0.34 | 0.69 | |
| OSWS: lifting | 50 | 0 | 5 | 1.02 | 1.61 | |
| OSWS: walking | 50 | 0 | 2 | 0.26 | 0.49 | |
| OSWS: sitting | 50 | 0 | 5 | 0.80 | 1.14 | |
| OSWS: standing | 50 | 0 | 5 | 0.68 | 1.11 | |
| OSWS: sleeping | 50 | 0 | 3 | 0.44 | 0.67 | |
| OSWS: sex life | 50 | 0 | 3 | 0.42 | 0.73 | |
| OSWS: social life | 50 | 0 | 2 | 0.38 | 0.70 | |
| OSWS: travelling | 50 | 0 | 4 | 0.50 | 0.89 | |
| OSWS: Total | 50 | 0 | 48 | 10.84 | 12.45 | |
| Post-natal depression | Edinburgh Postnatal Depression Scale | 50 | 0 | 21 | 6.14 | 5.50 |
| Activities of daily living | STarT: Leg pain | 50 | 0 | 1 | 0.24 | 0.43 |
| STarT: Shoulder pain | 50 | 0 | 1 | 0.46 | 0.50 | |
| STarT: Dressing | 50 | 0 | 1 | 0.24 | 0.43 | |
| STarT: Walking | 50 | 0 | 1 | 0.24 | 0.43 | |
| STarT: Fear | 50 | 0 | 1 | 0.16 | 0.37 | |
| STarT: Worry | 50 | 0 | 1 | 0.24 | 0.43 | |
| STarT: Catastrophising | 50 | 0 | 1 | 0.18 | 0.39 | |
| STarT: Mood | 50 | 0 | 1 | 0.18 | 0.39 | |
| STarT: Bothersomeness | 50 | 0 | 1 | 0.28 | 0.45 | |
| STarT: Total | 50 | 0 | 9 | 2.22 | 2.51 | |
| Life role participation | IPAQ: walking | 50 | 0 | 1680 | 301.23 | 315.63 |
| IPAQ: moderate intensity | 50 | 0 | 2880 | 187.04 | 428.78 | |
| IPAQ: vigorous intensity | 50 | 0 | 2880 | 178.80 | 515.78 | |
| IPAQ: Total | 50 | 0 | 4560 | 667.07 | 863.20 | |
3. RESULTS
Fifty females participated in the current study. Of the 50 females, 22 (44%) presented with LBP six weeks or more postpartum. In Table 1 the descriptive statistics of the total sample is presented.
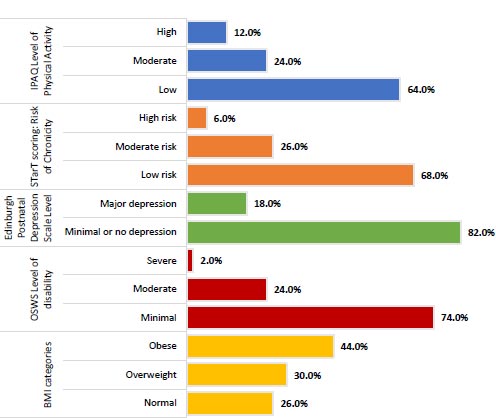
In Fig. (2), the different assessment tools used are broken down into sub-categories to show an overview of the total population scores.
The age of the women in the sample ranged from 19 to 46, with an average age of 30.6 years. On average, the number of children that the women have given birth to equalled two. The height and weight at the time of the study averaged 164 cm and 79.9kg, respectively, with a relatively broad range covered in both these metrics. Women included in the study were mostly considered to be obese based on their BMI, with no women being regarded as underweight. The BMI of the sample ranged from 19.8 to 44.6, averaging 29.6. With regards to respiratory function, the actual peak flow averaged 259.2 across all the women included in the sample, with the difference between their ideal peak flow and their actual peak flow ranging from 59.8 to 317.8. The average difference between these two metrics was 186.2.
The Trunk Stability Test revealed an average abdominal function of 0.15 and 0.17 on the left and right, respectively. This test provided an average range of between 0.0 and 0.5. As measured by OSWS, pain showed the highest average for lifting, sitting, and standing, with the total OSWS measurement recorded at 10.8. 74.0% of the sample could thus be regarded to show minimal levels of disability, 24% showed moderate levels of disability, and 2% showed severe levels of disability. The EPDS revealed that 18% of the sample had major depression. The maximum EPDS recorded was 21, but the average for this measurement was 6.1. The activity of daily living that showed the highest risk of chronicity on average was shoulder pain (SBT average of 0.46), followed by bothersomeness. Overall, the risk of chronicity could be regarded as low for 68% of the sample, moderate for 26% and high for 6% of the sample.
In general, the sample had mostly low levels of physical activity (64%), while only 12% of the women included in the sample showed high levels of physical activity. The total level of activity, as measured by IPAQ, had a maximum of 4560 but averaged at 667.1. The highest average IPAQ was recorded for walking (low level of activity).
The prevalence and characteristics of LBP for the total sample were compared. A summary of the comparison can be seen in Table 2.
The sub-categories of the main outcome measures were also compared for the group with and the group without pain, as seen in Fig. (3).
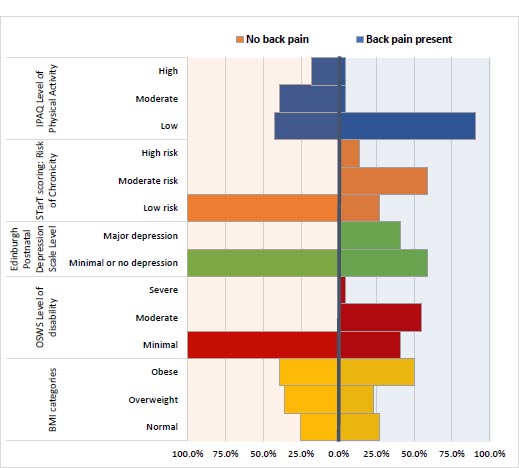
Table 2.
| Aspects Tested | Back Pain Present | Back Pain not Present | ||||||
| N | Mean | Std. Deviation | N | Mean | Std. Deviation | |||
| Demographics | Age in years | 22 | 30.14 | 5.19 | 28 | 30.89 | 6.37 | |
| Nr of children given birth to | 22 | 2.09 | 0.87 | 28 | 2.07 | 0.90 | ||
| Number of weeks postpartum during which the mother has still felt back pain | 22 | 17.14 | 11.46 | - | - | - | ||
| Anthropometric data | Height in centimetres | 22 | 164.18 | 4.11 | 28 | 163.86 | 5.51 | |
| Weight during pregnancy (or directly after giving birth) | 22 | 82.62 | 22.14 | 28 | 82.82 | 16.31 | ||
| Weight at the time of the study | 22 | 81.59 | 19.34 | 28 | 78.51 | 16.06 | ||
| BMI | 22 | 30.24 | 7.02 | 28 | 29.18 | 5.56 | ||
| Respiratory function | Actual Peak Flow | 22 | 253.70 | 67.72 | 28 | 263.57 | 57.48 | |
| Ideal Peak Flow | 22 | 446.61 | 9.26 | 28 | 444.52 | 15.63 | ||
| Difference between ideal and actual peak flow | 22 | 192.91 | 67.78 | 28 | 180.95 | 57.30 | ||
| Abdominal muscle function | Trunk Stability Test: Abdominal muscle functioning on the left | 22 | 0.12 | 0.08 | 28 | 0.17 | 0.10 | |
| Trunk Stability Test: Abdominal muscle functioning on the right | 22 | 0.17 | 0.15 | 28 | 0.17 | 0.13 | ||
| Trunk Stability Test: Average | 22 | 0.15 | 0.08 | 28 | 0.17 | 0.09 | ||
| Pain | OSWS: pain intensity | 22 | 1.23 | 0.92 | 28 | 0.07 | 0.26 | |
| OSWS: personal care | 22 | 0.77 | 0.87 | 28 | 0.00 | 0.00 | ||
| OSWS: lifting | 22 | 2.05 | 1.81 | 28 | 0.21 | 0.79 | ||
| OSWS: walking | 22 | 0.50 | 0.60 | 28 | 0.07 | 0.26 | ||
| OSWS: sitting | 22 | 1.64 | 1.22 | 28 | 0.14 | 0.45 | ||
| OSWS: standing | 22 | 1.45 | 1.30 | 28 | 0.07 | 0.26 | ||
| OSWS: sleeping | 22 | 0.86 | 0.77 | 28 | 0.11 | 0.31 | ||
| OSWS: sex life | 22 | 0.86 | 0.89 | 28 | 0.07 | 0.26 | ||
| OSWS: social life | 22 | 0.77 | 0.87 | 28 | 0.07 | 0.26 | ||
| OSWS: travelling | 22 | 1.14 | 1.04 | 28 | 0.00 | 0.00 | ||
| OSWS: Total | 22 | 22.55 | 9.97 | 28 | 1.64 | 2.18 | ||
| Post-natal depression | Edinburgh Postnatal Depression Scale | 22 | 10.95 | 4.51 | 28 | 2.36 | 2.30 | |
| Activities of daily living | STarT: Leg pain | 22 | 0.50 | 0.51 | 28 | 0.04 | 0.19 | |
| StarT: Shoulder pain | 22 | 0.82 | 0.39 | 28 | 0.18 | 0.39 | ||
| StarT: Dressing | 22 | 0.50 | 0.51 | 28 | 0.04 | 0.19 | ||
| StarT: Walking | 22 | 0.50 | 0.51 | 28 | 0.04 | 0.19 | ||
| StarT: Fear | 22 | 0.36 | 0.49 | 28 | 0.00 | 0.00 | ||
| StarT: Worry | 22 | 0.41 | 0.50 | 28 | 0.11 | 0.31 | ||
| StarT: Catastrophising | 22 | 0.41 | 0.50 | 28 | 0.00 | 0.00 | ||
| StarT: Mood | 22 | 0.41 | 0.50 | 28 | 0.00 | 0.00 | ||
| StarT: Bothersomeness | 22 | 0.64 | 0.49 | 28 | 0.00 | 0.00 | ||
| StarT: Total | 22 | 4.55 | 1.99 | 28 | 0.39 | 0.69 | ||
| Life role participation | IPAQ: walking | 22 | 134.40 | 136.10 | 28 | 432.31 | 354.82 | |
| IPAQ: moderate intensity | 22 | 95.45 | 161.18 | 28 | 259.00 | 548.85 | ||
| IPAQ: vigorous intensity | 22 | 72.27 | 211.88 | 28 | 262.50 | 656.78 | ||
| IPAQ: Total | 22 | 302.13 | 343.79 | 28 | 953.81 | 1032.73 | ||
The sample included 22 women that had varying levels of LBP postpartum and 28 women that had no LBP. When comparing the aspects measured for purposes of this study for those experiencing pain and those with no pain, the following could be observed: The average number of weeks for the women who experienced back pain was 17.1 postpartum.
The two groups were similar with regards to age, number of children given birth to, height and weight (those not experiencing pain only had a slightly low average weight at the time of the study). The BMI of the two groups were also relatively similar on average, but a more significant portion of the group experiencing back pain could be regarded as obese (50% vs 39.3% of those not experiencing back pain). With regards to respiratory function, the actual peak flow averaged 253.7 for those women experiencing back pain and 263.6 for those without back pain. The difference between their ideal peak flow and their actual peak flow averaged 192.9 and 180.9 for those with back pain and those without back pain respectively. The Trunk Stability Test revealed a slightly low average function on the left for those with back pain. The OSWS revealed minimal levels of disability for all those women without back pain, but only 40.9% of those with back pain could be regarded as minimal. 54.5% of those with back pain had moderate levels of disability, and 4.5% had severe levels of disability. As was evident when considering the total sample, the OSWS items with the highest score for those with back pain were lifting, sitting and standing, followed by pain intensity and travelling (all had an average score greater than 1).
The women with back pain had higher levels of depression when measured on the EPDS, with 40.9% of them showing major depression levels. The SBT scoring system revealed that 59.1% of the women with back pain had a moderate risk for chronicity, and 13.6% had a high risk for chronicity. The activities of daily living showing the highest risk of chronicity were shoulder pain, bothersomeness and walking. Although to a much low extent, some of the women with back pain also indicated shoulder pain.
Vast differences between the activity levels of the two groups were evident. Those without back pain were much more active, with 17.9% of them showing high levels of activity based on the IPAQ, 39.3% showing moderate activity and 42.9% showing low levels of activity. In contrast, only 4.5% of those with back pain showed high and moderate activity levels, respectively, with the remaining 90.9% showing low activity levels. The total level of activity, as measured by IPAQ, averaged 302.1 for those with back pain and 953.8 for those without back pain. The highest average IPAQ was recorded for walking (low level of activity) in both groups, though to varying degrees.
Correlation analysis was conducted between the variable indicating the presence or absence of LBP (coded as a 1 when back pain was present and 0 otherwise) and the various tests that were categorised based on the various scores. Given that these variables were categorical in nature, the Spearman Rank correlation coefficients were calculated. Spearman’s correlation determines the strength and direction of the monotonic relationship between two variables. The general form of a null hypothesis for a Spearman correlation is H0: There is no [monotonic] association between the two variables. In Table 3, the association between the variables are indicated.
| Dependent Variable: Back Pain Present or not | Spearman Correlation | Approx. Sig. | Result |
| BMI categories | 0.061 | 0.672 | No significant association |
| OSWS Level of disability | 0.667 | 0.000 | Significant association |
| Edinburgh Postnatal Depression Scale Level | 0.529 | 0.000 | Significant association |
| sTarT scoring: Risk level of Chronicity | 0.765 | 0.000 | Significant association |
| IPAQ Level of Physical Activity | -0.476 | 0.000 | Significant association |
| Aspect Tested | Null Hypothesis | Mann-Whitney U Test Statistic | Sig. | Decision |
| Demographics | The distribution of Age in years is the same across categories of back pain present or not. | 284.00 | 0.638 | Do not reject the null hypothesis. |
| The distribution of Nr of children given birth to is the same across categories of back pain present or not. | 323.00 | 0.756 | Do not reject the null hypothesis. | |
| Anthropometric data | The distribution of Height in centimetres is the same across categories of back pain present or not. | 314.00 | 0.906 | Do not reject the null hypothesis. |
| The distribution of Weight at the time of the study is the same across categories of back pain present or not. | 336.50 | 0.577 | Do not reject the null hypothesis. | |
| The distribution of Weight during pregnancy (or directly after giving birth) is the same across categories of back pain present or not. | 301.50 | 0.899 | Do not reject the null hypothesis. | |
| The distribution of BMI is the same across categories of back pain present or not. | 330.50 | 0.660 | Do not reject the null hypothesis. | |
| Respiratory function | The distribution of Difference between ideal and actual peak flow is the same across categories of back pain present or not. | 348.00 | 0.434 | Do not reject the null hypothesis. |
| Abdominal muscle function | The distribution of Trunk Stability Test: Average is the same across categories of back pain present or not. | 243.50 | 0.207 | Retain the null hypothesis. |
| Pain | The distribution of OSWS: Total is the same across categories of back pain present or not. | 612.00 | 0.000 | Reject the null hypothesis. |
| Post-natal depression | The distribution of the Edinburgh Postnatal Depression Scale is the same across categories of back pain present or not. | 586.50 | 0.000 | Reject the null hypothesis. |
| Activities of daily living | The distribution of sTarT: Total is the same across categories of back pain present or not. | 595.00 | 0.000 | Reject the null hypothesis. |
| Life role participation | The distribution of IPAQ: Total is the same across categories of back pain present or not. | 114.50 | 0.000 | Reject the null hypothesis. |
The BMI and the presence of LBP did not show any significant correlation. The OSWS level of disability and the presence of LBP showed a statistically significant and strong positive association with the presence of LBP postpartum (r=0.67). This implies a higher level of disability when back pain is present. The level of depression based on the EPDS and the presence of LBP showed a statistically significant and moderate positive association with the presence of LBP postpartum (r=0.53). This implies a higher level of depression when back pain is present. The risk level of chronicity and the presence of LBP showed a statistically significant and strong positive association with the presence of LBP postpartum (r=0.77). This implies a higher risk of chronicity when back pain is present. The level of physical activity and the presence of LBP showed a statistically significant and moderate negative association with the presence of LBP postpartum (r=-0.48). This implies a low level of activity when back pain is present.
Furthermore, the Mann-Whitney U test was conducted to test for statistical differences between those with back pain and those without with regard to the aspects measured in the study. The Mann-Whitney U test is a non-parametric test that can be used in place of an unpaired t-test (based on two independent groups). It is used to test the null hypothesis of whether observations in one sample tend to differ from the observations in the other sample. The results are displayed in Table 4.
The only aspects for which there were statistically significant differences between those women experiencing low back and those that did not was pain, postnatal depression, activities of daily living and life role participation. For all these variables, the total scores and not levels were used to test for statistically significant differences. Based on the p-value, these variables showed statistically significant differences at a 5% level as the p-value is below 0.05, and thus the respective null hypotheses could be rejected. As was evident from the previous analysis, the group with back pain had higher levels of pain/disability, depression and risk for chronicity. Low levels of physical activity were also recorded for those experiencing back pain. The Mann-Whitney U test then serves as confirmation that these differences could be regarded as statistically significant.
4. DISCUSSION
4.1. Point Prevalence of Persistent LBP Postpartum
The results of the current study indicated a point prevalence of 44% LBP that persisted six weeks after giving birth. The findings correlate with published literature [4-6] that indicates that prevalence ranges from 5-50% in females who experience persistent LBP postpartum. The high prevalence in the current study may also be a result of the study setting – the study was conducted in a tertiary institution, where a lot of patients with severe problems (such as, for example, persistent LBP postpartum) seek assistance. The prevalence of persistent LBP postpartum may be lower in primary- and secondary healthcare facilities.
4.2. Characteristics of Persistent LBP Postpartum
4.2.1. Anthropometric Data
The height and weight of the participants (n=50) in the study averaged 164 centimetres and 79.9 kilograms. The BMI indicated that most females in the study were overweight/obese and that none of the women were underweight. Although the anthropometric data for the two groups were similar, it is interesting to note that a larger portion of the group who experienced LBP was obese (50% vs 39.2% of non-LBP participants). The findings of the current study are similar to the reported literature, which indicates that the majority of women exceed the expected weight gain during pregnancy [22]. For both groups in the current study, this was the case. The current study’s result indicated that obesity and being overweight were prevalent in patients with and without LBP, and no significant correlation was found between being obese and having LBP, which contradicts published literature [23]. The results from the current study indicate that further research on larger samples is needed to draw conclusions on the impact of being overweight/obese on LBP, especially in the postpartum population.
4.2.2. Respiratory Function
Literature indicated that respiratory function is significantly decreased in patients with LBP [24, 25]. In the current study, the results obtained differ from published literature in that the results indicated that respiratory function for both the pain-free and LBP groups was decreased. Results of the current study indicate that the actual peak flow averaged 259.2 across all the women included in the sample, with the difference between their ideal peak flow and their actual peak flow ranging from 59.8 to 317.8. The average difference between these two metrics was 186.2. Although the decreased respiratory function was not a characteristic of persistent LBP postpartum in the current study, the low scores for the entire population are indicative of decreased respiratory function postpartum. An extensive literature review yielded no published results on possible reasons for the decrease in respiratory function postpartum. When the other results of the study are considered, it can be speculated that the low activity levels found in both groups of participants could be a contributing factor to the decreased respiratory function. Various research studies have been published that indicate that peak flow measurements are low in people with sedentary lifestyles; however, none of these studies was conducted on females who gave birth specifically [26-28]. From the results of the current study, it is recommended that further research be conducted to establish whether there is a correlation between sedentary lifestyles postpartum and decreased respiratory function.
4.2.3. Abdominal Muscle Function
The Trunk Stability Test revealed an average abdominal function of 0.15 and 0.17 on the left and right, respectively. This test provided an average range of between 0.0 and 0.5. The Trunk Stability Test has not been used on females postpartum prior to the current study (the conclusion is made after an extensive literature search). However, when compared to healthy females, the Trunk Stability Test scores for all participants were extremely low. The published information on ‘normal’ (non-patients / pain-free individuals) were 5.1 on the left and 6.5 on the right [29]. The improved performance on the righthand side that is noted in the current study as well as the published literature could be a result of dominance. However, research to corroborate this statement will have to be conducted. Another reason why the entire population in the current study could have low abdominal muscle activation is the birthing history. In the current study, the birthing history was not specifically asked – a limitation that affects the outcome of the study. Caesarean section (C-section) is the most frequently performed surgical procedure in women of reproductive age, and due to the trauma incurred during the procedure, the abdominal muscles of patients are weakened [30]. Additionally, natural births also result in damaged abdominal muscles [31], which could further explain the decreased abdominal muscle function observed in the current study.
4.2.4. Pain
The OSWS measured the pain, and for the total sample, the highest average was recorded for lifting, sitting, and standing. 74% of the entire sample showed minimal levels of disability, 24% moderate, and 2% severe levels of disability. When only the group with LBP is considered, 54.5% presented with moderate levels of disability and 4.5% with severe levels of disability. The OSWS level of disability and the presence of LBP showed a statistically significant and strong positive association with the presence of LBP postpartum (r=0.67). This implies a higher level of disability when back pain is present. The results from the current study are similar to the published literature [10]. Persistent pain that is positively associated with disability (whether moderate or severe levels of disability) negatively impacts patients’ quality of life [10]. Postpartum patients with pain and disability’s self-reported health are negatively affected [32]. Although published research aligns with the findings of the current study, there are discrepancies in reporting of quality of life when living with pain and disability postpartum. It is because of this reason that future research specifically investigating this phenomenon is recommended.
4.2.5. Postnatal Depression
Postnatal depression is described as a non-psychotic disorder which is characterised by a persistent mood disorder; loss of pleasure and interest in usual activities; sleepiness or lack thereof; psychomotor disorders; eating disorders; loss of concentration; and a decline in self-esteem [33]. The incidence of postnatal depression in South Africa has been reported as high (38.8%) [34]. In the current study, 18% of the entire sample experienced major depression. However, when only the females with persistent LBP were considered, 40.9% showed signs of major depression. Although the results of the current study are slightly higher, it is comparable to the literature [33]. The level of depression based on the EPDS and the presence of LBP in the current study also showed a statistically significant and moderate positive association with the presence of LBP postpartum (r=0.53). This implies a higher level of depression when back pain is present. Postnatal depression should not be separated from physical- and functional changes [35]. Maternal self-efficacy and postpartum depression directly correlate with functional status [35]. Similar to the results in the current study, literature [35] showed that most of the participants had decreased levels of activity and were sitting more than promoting mobility. A positive correlation between decreased mobility, increased back pain and postnatal depression was found.
4.2.6. Activity Limitations and Participation Restrictions
Activity levels for the entire group were measured with the SBT. Overall, the risk of chronicity was low for 68% of the sample (entire group), moderate for 26% and high for 6% of the sample. When the LBP group was isolated, 59.1% of the LBP group had a moderate risk for chronicity, and 13.6% had a high risk. The level of physical activity and the presence of LBP showed a statistically significant and moderate negative association with the presence of LBP postpartum (r=-0.48). This implies a low level of activity when back pain is present. Regarding physical activity, as measured by the iPAQ, most of the total sample had low levels of physical activity (64%). However, when the LBP group and pain-free groups were compared, vast differences between the activity levels of the two groups were evident. Those without back pain were much more active, with 17.9% of the sample showing high levels of activity based on the IPAQ, 39.3% showing moderate activity, and 42.9% showing low activity levels. In contrast, only 4.5% of those with back pain showed high and moderate activity levels, respectively, with the remaining 90.9% showing low activity levels.
In literature, low physical activity levels correlate with LBP in the postpartum population, supporting the current study’s findings [4, 36, 37]. The inability to perform basic activities of daily living can also result in the experience of decreased quality of life [38]. Females who participated in physical activity while pregnant and directly after pregnancy had a significantly low risk of developing LBP in the first six months after giving birth [39]. These findings indicate the importance of participation in physical activities (including activities of daily living) to assist patients with preventing and limiting LBP as much as possible before it escalates to the point where there is a high risk of chronicity [39]. There is ample evidence to indicate a correlation between LBP and decreased physical activity levels (both on activity and participation levels of the ICF) published in the literature. However, the exact extent to which physical activity levels influence LBP and the experience thereof is not known and warrants further investigation.
CONCLUSION
In the current study, the aims were to determine the prevalence of persistent LBP postpartum and to determine the characteristics of persistent LBP postpartum. The results from the study indicated a high point prevalence of LBP six or more weeks postpartum (44%). The results, although high, were similar to the published literature.
Characteristics of LBP were measured using the ICF framework as a guideline. On the impairment level, the level of disability and postnatal depression experienced by women with LBP postpartum differed from the pain-free group. The level of disability was higher in the LBP group than for the pain-free group (54.5% - moderate disability; 4.5% - severe disability). Postnatal depression measures indicated that 40.9% of women with LBP experienced major depression. Postnatal depression also had a statistically significant and moderate positive association with the presence of LBP (p=0.000; r=0.53). On activity and participation levels, 59.1% of females with LBP postpartum had a moderate risk for chronicity and 13.6% a high risk. Physical activity measurements between the two groups showed the biggest differences. Participants who were pain-free were much more physically active than participants with LBP. The results from the study implied low levels of physical activity in the presence of LBP.
LIST OF ABBREVIATIONS
| BMI | = Body Mass Index |
| EPDS | = Edinburg Postnatal Depression Scale |
| ICC | = Interclass Correlation Coeffient |
| ICF | = International Classification of Health Disability and Function |
| iPAQ | = International Physical Activity Questionnaire |
| LBP | = Low Back Pain |
| OPD | = Outpatient Department |
| OSWS | = Oswestry LBP Disability Questionnaire |
| SBT | = Keele sTarT Back Screening Tool |
ETHICS APPROVAL AND CONSENT TO PARTICIPATE
This study was approved by Sefako Makgatho Health Sciences University Research & Ethics Committee (approval no. SMUREC/H/96/2019:PG).
HUMAN AND ANIMAL RIGHTS
No animals were used in this research. All procedures performed in studies involving human participants were in accordance with the ethical standards of institutional and/or research committee and with the 1975 Declaration of Helsinki, as revised in 2013.
AVAILABILITY OF DATA AND MATERIALS
The data set has been uploaded to the Zenodo Repository, https://zenodo.org/record/8207336 doi 10.5281/zenodo .8207336.
ACKNOWLEDGEMENTS
The authors would like to acknowledge all participants in the study. Furthermore, Ms Jacolize Meiring is acknowledged for her contribution to the statistical analysis of the results.