Sample Size Estimation for a Non-inferiority Pain Management Trial
Abstract
Introduction:
Measuring pain and pain relief are the primary concerns in pain management. Sample size estimation in pain management with non-inferiority (NI) study design and assessment of specific-NI margin endpoints may be challenging as pain and its improvement are measured and reported on different endpoints.
Methods:
Multiple endpoints were reported frequently to measure pain and pain improvement. The sum of pain intensity difference (SPID[0-t]) at a specific time is the recommended endpoint for the measurement of pain by the United States Food and Drug Administration. Statistical information on SPID and other endpoints reported in multiple works in the literature (preferably from placebo-controlled trials) was collected and compared to identify a suitable NI margin. A difference of 20% was considered the default NI margin for evaluation, and the sample size was calculated for each endpoint.
Results:
The sample size based on the FDA-recommended primary endpoint SPID was found to be larger. This may be a concern for overall clinical operation and the availability of patients for recruitment in time. The sample size obtained for the minimal clinically important difference (MCID) endpoint was feasible and justifiable from an operational and clinical standpoint.
Conclusion:
Evaluation and assessment of multiple endpoints before designing an NI study enable rapid decision-making on endpoint selection and increase operational efficiency.
1. INTRODUCTION
Disease burden [1] and increasing demand [2] for available drugs continue to drive the search for new treatment options across therapy areas. New innovative and alternative treatment options over standard-of-care treatments add value to overall disease management. The use of non-inferiority trials is an effective strategy adopted [3, 4] by researchers and pharmaceutical companies to assess the benefit of a novel drug compared to a reference drug or standard-of-care. In a non-inferiority study, the intent is to show that the new drug is not inferior to the reference or standard of care by an acceptable margin, which is defined as the non-inferiority margin. The non-inferiority margin is the amount of (inferiority) difference between a test drug and a reference drug that could have clinically no meaningful difference in efficacy.
In the absence of country-specific regulations and guidance for the industry about the primary endpoint for conducting a clinical trial in a specific therapy area, choosing the right primary endpoint becomes a challenge. Furthermore, in view of risk-benefit comparisons of multiple endpoints, all of which are fairly prevalent and accepted within the clinical community, choosing one primary endpoint is even more difficult. As the primary endpoint has a direct impact on the sample size of the trial and operational costs, it should be carefully and wisely chosen to keep its clinical and scientific merits and risk in mind.
In pain management therapy, the centrally acting, non-opioid analgesic nefopam has demonstrated significantly better analgesic activity than placebo in patients with acute postsurgical or fracture pain [5]. In combination with two other non-opioids, paracetamol and ketoprofen, nefopam has demonstrated significant morphine-sparing effect after different types of surgeries, such as cardiac, abdominal, gynecology, orthopedic, and urology, and was found to be associated with superior analgesia in the first 24 h compared to morphine alone [6], indicating an additive analgesic effect. Paracetamol is a non-opiate non-salicylate analgesic with antipyretic and anti-inflammatory properties that blocks the release of certain chemical messengers that cause pain. It is widely and effectively used in both prescription and over-the-counter products to reduce pain and fever [7]. Various studies have reported paracetamol to be effective in controlling pain after oral surgery [6-8]. When paracetamol is used in combination with other analgesics, it provides superior pain relief and permits a reduction in opioid dose [9-11].
Tramadol is an opioid analgesic that works by blocking the transmission of pain signals to the brain. A fixed-dose combination (FDC) of tramadol and paracetamol [12] is commonly prescribed [13] in post-operative acute pain management and is well-known in family practice for pain relief [13]. Here, we propose a case study involving the design of an inferiority trial to assess the efficacy of an FDC of nefopam + paracetamol versus tramadol + paracetamol in pain management.
Sample size estimation is an important and vital component in planning a clinical trial [14]. For determining the sample size in planning any non-inferiority clinical trial, one of the biggest challenges is to identify a clinically acceptable non-inferiority margin for the considered primary endpoint of the study. Further sample size estimation requires an understanding of the primary objective of the research and its endpoint (measurement scale). This is also critical in the planning of pain management studies, as pain/pain relief is frequently measured and reported on several different endpoints and measurement scales.
1.1. Objective
The objectives of this case study were 1) to explore different sample size estimations for conducting a non-inferiority study on pain management by comparing the efficacy profile of two FDCs nefopam hydrochloride + paracetamol versus tramadol + paracetamol and 2) to choose a suitable endpoint as the primary objective of the study using the proposed sample size options considering study feasibility regarding resourcing and operational costs.
2. MATERIALS AND METHODS
To measure the clinical efficacy in pain management studies, several endpoints have been suggested and frequently reported in the literature, and they are in practice within the medical community [15-17]. We were unable to find any specific recommendations on the selection of endpoints for pain measurement from the Indian Health Authority Central Drugs Standard Control Organization (CDSCO). However, the United States Food and Drug Administration, in its draft guidance for industry document, mentioned that “The primary efficacy analysis should compare the sum of pain intensity difference (SPID) between treatments at a prespecified time point that, at a minimum, includes the duration of drug effect, and may extend beyond this duration” [18]. To understand all frequently reported endpoints in pain management studies, an intensive literature search and review were performed. Table 1 provides a summary of the various literature-reported endpoints for the measurement of pain and pain relief. These endpoints are based on the use of continuous scales, such as the visual analog scale (VAS) [19] or a 10-point numerical rating scale (NRS) [20].
As per ICH E10 [21], the margin chosen for a non-inferiority trial cannot be greater than the smallest effect size that the active drug would be reliably expected to have compared with a placebo in the setting of the planned trial. Hence, to understand the non-inferiority margin of identified endpoint, we performed a literature search for preferably placebo-controlled studies with our reference drug (tramadol + paracetamol). We assumed a non-inferiority margin of 20% [22] of the difference. Under proven non-inferiority, this non-inferiority margin will ensure a minimum of 80% of reference treatment effectiveness in our test treatment. Wherever an approximation was needed, we used a conservative approach, which yielded a higher sample size for the given assumption/approximation. The literature reported [22] reference drug and placebo responses, along with their respective non-inferiority margins (derived/proposed), is summarized in Table 2.
2.1. Sample Size Calculation
While calculating the sample size, the overall significance level (α) was maintained at 5%; however, the actual error rate was to be controlled at α = 0.025 because of one-sided interest.
For continuous endpoints, the below-mentioned formula was used for the computation of sample size [23]:
n = (Z(1-β)+ Z(1-α))2*σ2 / [(µA-µB)-dNI]2 where α is the type I error rate, (1- β) is the power, and Z indicates the critical value of the area under a standard normal distribution.
(µA - µB) is the mean difference between test drug (A) and reference drug (B), and (dNI) is the non-inferiority margin for the respective endpoint.
For dichotomous categorical endpoints, the below-mentioned formula was used for the computation of sample size [24-26]:
n = (Z(β)+ Z(α))2*[PA *(1- PA) + PB*(1- PB)] / (PA - PB--dNI)2,
Where α is the type I error rate, (1- β) is the power, and Z indicates the critical value of the area under a standard normal distribution. (µA - µB) is the mean difference between test drug (A) and reference drug (B), and (dNI) is the non-inferiority margin for the respective endpoint.
The estimated sample sizes for each endpoint based on the above-mentioned formulae, literature-reported information about reference drug effectiveness in comparison with placebo, and the calculated NI margins for the respective endpoints, are summarized in Table 3.
2.2. Choice of the Primary Endpoint
The SPID from baseline to 8 hours postdose, SPID(0-8), is the most frequently used endpoint as well as the recommended endpoint by US FDA in its guidance for the industry [18]. Therefore, for our proposed case, we used the SPID (0-8) as the primary endpoint to compare the effectiveness of the FDC.
However, given the available resources and after performing feasibility at hospitals for the availability of subjects willing to participate in a putative clinical trial for the FDC, it was found that the study would not be feasible at a proposed sample size of 1632 with SPID(0-8) as the primary endpoint. Commercial aspects, such as the cost of conducting the study with a large sample size and the market potential of the developed drug to bear the high development cost, also need to be considered when selecting the sample size.
2.3. Alternative Proposal for Primary Endpoints
Table 3 shows that in comparison with continuous endpoints, categorical endpoints require significantly smaller sample sizes while maintaining the same overall error rates and study power. Therefore, even though FDA recommends SPID as the primary endpoint for such a pain management study for FDC development where clinical efficacy is well established for individual drugs, we proposed meaningful pain relief (MPAR) with minimum clinically important difference MCID) [27-29] as the primary endpoint, and SPID as the key secondary endpoint.
3. RESULTS
The sample size requirement depends on the nature of sensitivity and variation of the chosen primary objective and corresponding endpoint for the study. The measurement of pain became complex and composite when it was measured with respect to time points. The different endpoints used to measure pain, pain intensity, and pain improvement are summarized in Table 1.
For the above-mentioned different endpoints, the non-inferiority margins are derived considering literature that reported a placebo treatment effect and a 20% of acceptable inferiority margin. The derived non-inferiority margins for each endpoint are summarized in Table 2.
With the help of literature reported treatment effect (the control treatment/reference treatment) and expected treatment effect of our test treatment and with the above derived non-inferiority margins of each endpoint, the sample size was derived for each endpoint (Table 3).
Table 2.
| Endpoint / Assessment Parameter |
Scale | Tramadol + Paracetamol | Placebo | Difference (Maximum of Treatment Effect) Margin M1 | 20% of the Difference as an Acceptable NI Margin |
|---|---|---|---|---|---|
| Continuous scale: Mostly on Visual Analog Scale (VAS) or Numeric Rating Scale (NRS): Mean (SD) | |||||
| PI (8) | VAS | 5.5 (1.3) | 5.2 (1.3) | 0.3 | 0.06 |
| PID (8) | VAS | 1.0 (1.5) | 0.3 (1.5) | 0.7 | 0.14 |
| SPID (8) | VAS | 14.4 (15.21) | 2.2 (8.98) | 12.2 | 2.44 |
| % of Max SPID (8) | VAS | 34.1 (34.89) | 5.2 (21.48) | 28.9 | 5.78 |
| PAR (t) | VAS | 2.2 (1.5) | 0.5 (1.2) | 1.7 | 0.34 |
| Max PAR | VAS | 2.9 (1.5) | 2 (1.2) | 0.9 | 0.18 |
| TOTPAR (t) | NRS | 9.2 (7.65) | 1.9 (3.89) | 7.3 | 1.46 |
| % of Max TOTPAR (8) | NRS | 34.2 (30.76) | 7.1 (15.86) | 27.1 | 5.42 |
| Categorical scale: Mostly dichotomous in % of responders | |||||
| 50% of Max TOTPAR (8) | NRS | 35.50% | 5.30% | 30.2 | 20 |
| 30% of Max TOTPAR (8) | NRS | 35.50% | 9.90% | 25.6 | 20 |
| MPAR (8) | VAS | 72.90% | 25.20% | 47.7 | 20 |
| Endpoint | Estimated Sample Size |
|---|---|
| PI (8) | 19734 |
| PID (8) | 4828 |
| SPID (8) | 1632 |
| % of Max SPID (8) | 1534 |
| PAR (t) | 820 |
| Max PAR | 2922 |
| TOTPAR (t) | 1156 |
| % of Max TOTPAR (8) | 1356 |
| 50% of Max TOTPAR (8) | 242 |
| 30% of Max TOTPAR (8) | 242 |
| MPAR (8) | 728 |
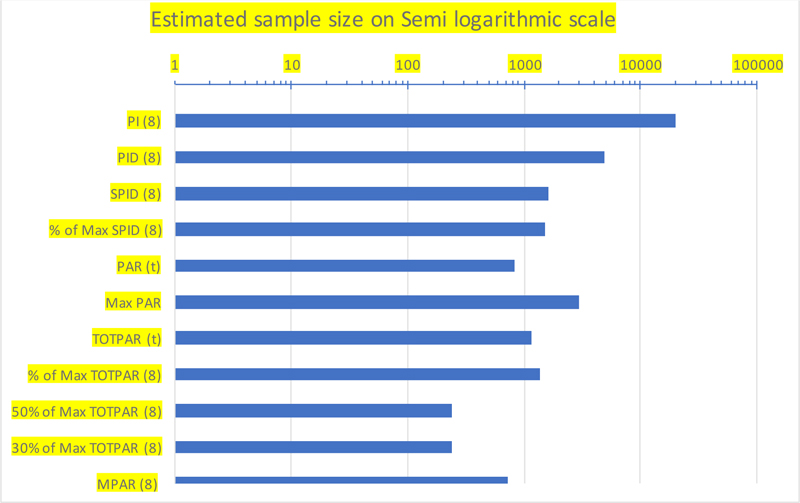
With the alternative proposal, which demands a sample size of a minimum of 728 evaluable subjects with 90% power, which is less than half of the sample size of 1632 needed with SPID as the primary endpoint, a visual comparison of the recommended sample size against each endpoint is made on a semi-log scale, as shown in Fig. (1).
The alternative proposed sample size was reasonably acceptable for the proposed case (both drugs in their independent form have well-proven efficacy, are available in the market, and the fixed-dose combination of both needs to be non-inferior to their free form) considering resourcing and operational costs involved in the development of FDC vs. the actual benefit and added convenience to the patients.
However, the risk and benefits of such a proposal should be considered in terms of its acceptance by the clinical community and regional regulatory authorities and benefits to subjects participating in the clinical study.
4. DISCUSSION
In view of the proposed case, especially with a non-inferiority study design, the development of an FDC had the primary aim of adding efficacy to treatment management. When the effectiveness and safety of individual drug components are well proven, the research and development costs of a non-inferior FDC with a very high sample size have the potential to increase the cost of a drug available to patients, thus questioning the rationale of such FDC development.
As per the general statistical principle for fixed sample size, making any inference on continuous data point is more powerful than discrete, which means that for our primary endpoint, we may need a smaller sample size on continuous outcome over a discrete outcome. However, the FDA-recommended endpoint SPID is a derived composite and needs time, time intervals, and multiple assessments of pain intensity difference. This makes SPID, as the primary endpoint, more sensitive and accurate, containing the entire spectrum of pain profiles with respect to time. Simultaneously, due to its statistical sensitivity and variability in nature, the sample size estimate on this endpoint tends to be larger. It may become non-feasible for trial overall clinical operations and cost-effective for non-inferiority study purposes.
The alternate proposal of choosing the proportion of subjects achieving MPAT (t) with MCID criteria as the primary endpoint required a significantly lower (lesser than half) sample size (728) in comparison to the first proposal. With this sample size for the primary endpoint and SPID as the key secondary endpoint, it is expected that optimal information may be obtained about the entire spectrum of pain profiles during treatment.
The endpoint MPAT (t), with MCID criteria as the primary endpoint, demands a very low sample size compared to SPID and serves the statistical purpose of achieving good power with a lesser sample size. It has its own limitations. It only assesses at the end of the study how many subjects received clinically meaningful pain relief. Concerning pain relief at an interim time point, this cannot be a very suitable endpoint. The use of such an endpoint should always be in alignment with the clinical context of relevance. Moreover, it should be accompanied by other continuous endpoints like PID and SPID as key secondary objectives for a better understanding of the treatment profile.
The limitation of the present study is that the information needed to estimate the sample size was not available from previous/pilot studies for the test treatment. We selected those studies where all mentioned endpoints were reported to be consistent and comparable in the sample size proposal.
CONCLUSION
A clinically acceptable endpoint and a well-powered adequate sample size for the selected endpoint are important and essential criteria in the design of clinical trials. The dependency of sample size on the selected endpoint and the chosen non-inferiority margin increase the complexity of sample size estimation.
In conclusion, the study aimed to propose a clinically acceptable endpoint for evaluating the effectiveness of an FDC of nefopam + paracetamol versus tramadol + paracetamol in managing pain. SPID (0-8), feasibility of SPID (0-8), and MPAR with MCID criteria were determined, and an endpoint with a reasonably feasible sample size considering operational, resource, and development costs was chosen. Such a strategy may be employed in determining endpoints and sample sizes for similar studies in pain management.
LIST OF ABBREVIATIONS
| FDC | = fixed-dose combination |
| CDSCO | = central drugs standard control organization |
| SPID | = sum of pain intensity difference |
| VAS | = visual analog scale |
ETHICS APPROVAL AND CONSENT TO PARTICIPATE
Not applicable.
HUMAN AND ANIMAL RIGHTS
No animals/humans were used in the studies that are the basis of this research.
CONSENT FOR PUBLICATION
Not applicable.
AVAILABILITY OF DATA AND MATERIALS
The data supporting the findings of the article is available in public domain at mentioned below URL.
1. https://bmjopen.bmj.com/content/9/2/e023715
2. https://bmcanesthesiol.biomedcentral.com/articles/10.1186/ s12871-016-0174-5.
FUNDING
None.
CONFLICT OF INTEREST
The authors declare no conflict of interest, financial or otherwise.
ACKNOWLEDGEMENTS
Declared none.